Understanding satisfaction with work-life balance
Exercises developed by Jen Buckley
In this exercise, you will use correlation and regression to examine satisfaction with work-life balance 🙂⚖️, including:
the correlation between satisfaction with work-life balance and satisfaction with a person’s financial situation. ⚖️💰
how satisfaction with work-life balance is related to financial satisfaction, gender and full-time/part-time work. ⚖️⚧️⏲️
Learning outcomes
The learning outcomes of this section are:
can use correlation to examine the relationship between continuous variables.
can create regression models to examine relationship between variables including adding dummy variables.
Correlation
To start examining the relationship between satisfaction with work-life balance and satisfaction with other aspects of life, we will examine correlations between the following variables:
MCZ_13Overall, how satisfied are you with the balance between the time spend on paid job and the time spend on other aspects of life?MCZ_10Overall, how satisfied are you with your financial situation?MCZ_7Overall, how satisfied are you with your physical health?
Use the SPSS menus:
Analyze > Correlate > Bivariate.
Add
MCZ_13,MCZ_7andMCZ_10to the Variables list.OK.
In the output window, examine the results.
Is satisfaction with work life-balance correlated with
Satisfaction with physical health?
Satisfaction with financial situation?
Yes, there are statistically significant weak positive correlations:
- Satisfaction with physical health? 0.239 (p<0.001).
- Satisfaction with financial situation? 0.258 (p<0.001).
Regression
We are going to try to further understand satisfaction with work-life balance by using regression. We will create three regression models. Each model will include an additional variable:
Model 1: Satisfaction with financial situation
Model 2: Satisfaction with financial situation and gender
Model 3: Satisfaction with financial situation, gender, and full-time/part-time.
Model 1
To make the first model,
Analyze > Regression > Linear
Under dependent variable, add the variable MCZ_13.
Under independent variable, add the variable MCZ_10.
Instead of OK, click Paste. This will add the code for the model to a syntax file. This is a helpful feature for learning syntax, and creating a record of what you have done.
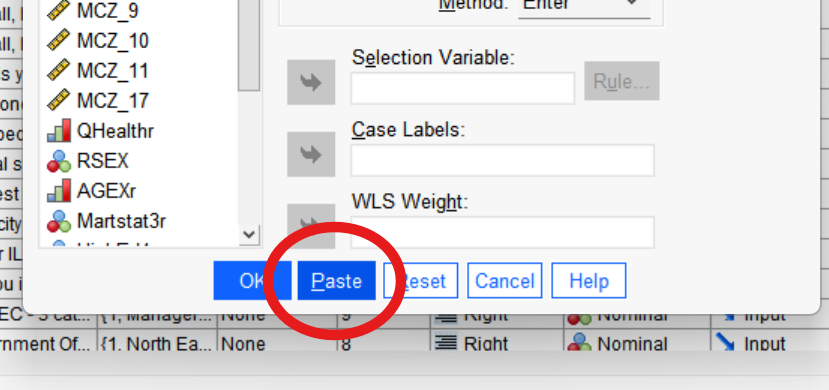
You should see something like the image below in a syntax file.
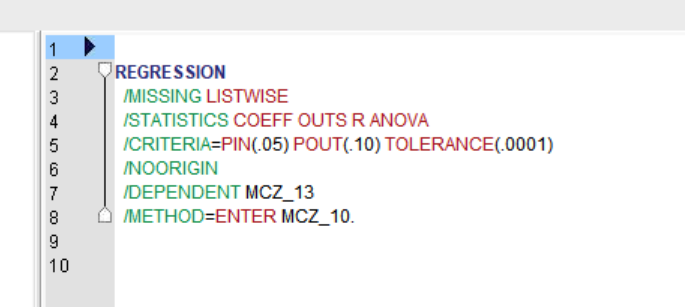
- Run the model by selecting the code in the syntax file and pressing the green arrow.
Check your results - can you match the results to those in the table below (with some rounding!).
| Variables | Model 1 (B unstandardised coefficients) |
| Constant | 5.096 |
| Satisfaction with financial situation | 0.260 (0.029) ** |
| Male | - |
| Fulltime | - |
| R2 | 0.066 |
Note: * p-values less than 0.05 and ** p-values less than 0.01.
For every unit increase in satisfaction with financial situation, how much does satisfaction with work-life balance increase or decrease?
According to the model, how much of the variation in satisfaction with work life-balance is associated with satisfaction with financial situation?
What might these results suggest about the relationship?
According to this model, for a unit increase in satisfaction with financial situation, satisfaction with work-life balance increases by 0.26.
Approximately 6.6% (R2=.066) of the variance in satisfaction with work–life balance is accounted for by a model including satisfaction with one’s financial situation.
There is a relationship between financial satisfaction and satisfaction with work-life balance. Is it causal i.e. does financial satisfaction lead to greater satisfaction with work-life balance? We don’t know from these results. Moreover, the R2 value indicates that if financial satisfaction has some influence on work-life balance satisfaction, other factors explain most of the variance in work-life satisfaction.
Dummy variables
Categorical variables need to be added to regression models as dummy variables with values of 0 or 1.
We therefore need to recode some variables in preparation for the next steps in our model building, where we add gender and full-tim/part-time.
In a syntax file, copy and run the code below.
*create dummy variables for sex, part-time/full-time work.

RECODE RSEX (1=1) (2=0) (ELSE=SYSMIS) into Male.
FREQUENCIES Male.

RECODE FtPtWkr (1=1) (2=0) (ELSE=SYSMIS) into Fulltime.
CROSSTABS FtPtWkr BY Fulltime.
Model 2
Create Model 2 by adding gender to the model. Use the new variable named Male. This is a dummy variable coded as 1=Male and 0=Female.
Analyze > Regression > Linear
Under dependent variable, add the variable MCZ_13
Under independent variable, add the variable MCZ_10 and Male
Paste to your syntax file.
Before running the code, compare the syntax for Model 1 and Model 2.
- Run the code from the syntax file.
What can we conclude about gender differences in satisfaction with work-life balance?
Does including gender increase the R2 value?
According to this model, on average, males are less happy with their work-life balance than females, controlling for differences in satisfaction with financial situation. This means the negative association is independent of satisfaction with financial situation.
When we add gender there is a very small increase in the R2 value. So still lots of variation in satisfaction unexplained by the model.
Model 3
Repeat the above process to add the binary variable Fulltime indicating whether someone works full- or part-time to the model. Either use the menus or see if you can adapt the syntax from Model 2 to include the new variable.
Check your results, match the results in the table below (with rounding!).
| Variables | Model 1 | Model 2 | Model 3 |
| Constant | 5.10 | 5.351 | 5.87 |
| Satisfaction with financial situation | 0.26 (0.03) *** | 0.252 (0.29)** | 0.268 (0.029)** |
| Male | - | -..428 (0.13)** | -0.39 (0.135) |
| Fulltime | - | - | -1.187 (0.145)** |
| R2 | 0.066 | 0.076 | 0.13 |
Note: * p-values less than 0.05 and ** p-values less than 0.001.
What can you conclude about the relationship between working full or part-time and satisfaction with work-life balance?
When we account for working full-time, what happens to the gender difference in satisfaction with work-life balance?
Does the value of R2 increase?
Working full-time is associated with lower satisfaction with work-life balance with an average score -1.187 less than those working part-time when we control for differences in satisfaction with financial situation and gender.
Accounting for differences between full-time and part-time employment, the difference between males and females reduces and is no longer statistically significant. (Why? Perhaps males are less satisfied on average because more men work full-time.)
The R2 value increases when we added Fulltime to the model.
Prediction
You can use the results of a regression model to estimate values for people with specific criteria.
In this case, let’s use Model 3 results to predict someone’s satisfaction with their work-life balance if they are male, work full-time and score 7 on their satisfaction with their financial situation.
This is the regression equation
= 5.87+0.268(Financial Satisfaction)−0.39(Male)−1.187(Fulltime)
Add the values:
Financial Satisfaction = 7
Male = 1 (yes, male)
Fulltime = 1 (yes, full-time)
=5.87+(0.268×7)−(0.39×1)−(1.187×1)
=5.87+1.87-0.39-1.187
=6.17
Calculate the score for a female working part-time who is equally satisfied with their financial situation?
=5.87+0.268(7)−0.39(0)−1.187(0)
=5.87+1.876
=7.746
So the female part-time worker’s predicted work–life balance satisfaction is about 1.6 points higher on average than the male full-time worker’s, controlling for satisfaction with financial satisfaction.
Extra
Can you think of any problems with this model? For example, are there important factors left out? Do you agree with decisions about dependent and independent variables?
Add one of the following variables to the model
Self-rated health (remember about dummy variables)
Satisfaction with health