Introduction: the SPSS environment and data
Exercises developed by Jen Buckley
Before examining the data, Exercise 1 will help you get familiar with the SPSS environment and the dataset used in the exercises.
Learning outcomes
The learning outcomes of this section are to:
- Understand the basic SPSS software environment and how data is stored.
Load the data
Load the downloaded data-set into the software:
either double click the downloaded file (this does not always work on networked computers).
or use the menus in SPSS (File > Open).
Explore the SPSS environment
In SPSS , you have a:
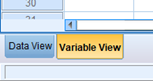
variable view
data view
You can alternate between the two by clicking the tabs at the bottom left of the screen.
The variable view
What can you see in the variable view?
- Click on the variable view tab.
The variable view lists all the variables in the dataset, with one variable per row.
Each column gives a different piece of information regarding the variable. Important information includes:
Name: codename for the variable. It might be a shortened version of the question that was asked in the survey, for example the question ‘how old are you’ would be given the variable name ‘age’.
Label: more descriptive description of the variable such as ‘Age in years’.
Values: Variables contain values.
Some values have labels associated with each value. For example, a variable measuring sex would include the categories of male and female which could be coded as male=0 and female=1. Values labels tell you what values mean. For example, the value 0 has the label ‘male’.
To see the values and value labels for a variable, click on the relevant cell and then click to the right of the cell.
Not all variables have value labels as the values are meaningful e.g. values for income, age, and number of hours worked per week, are all measured numerically.
Missing: Data can include missing values. For example, in a survey some people may not answer all questions (‘item non-response’) and sometimes questions are not relevant to all people (Inapplicable values relate to questionnaire routing).
Missing and inapplicable values tend to be coded as negative numbers (-8 -9 etc.) or very high numbers (99).
Setting these values as missing in SPSS means they are not included in calculations.
Data View
- Now click on the data view tab.
In the data view,
each column represents a variable, the variable names are written at the top of the columns.
each row represents a unit of data or observation which might be an individual, or a company, or a household.
each cell therefore is a single piece of data that was collected for one unit of data.
You can switch between the ‘values’ and ‘value labels’ for each piece of data. To change between the two, select value labels in the view menu

Explore the dataset
Now, explore the dataset to find the answers to the following questions.
How many variables are in the dataset?
What is the variable name and variable label for the 3rd and 15th variables?
What are the values and value labels for the 16th variable?
How many units of data are there? (tip: scroll to the bottom on the data view sheet)
Is the 1st unit of data Male or Female. What is their age group?
25
MCZ_1‘Overall, how satisfied are you with your life nowadays?’ andQHealtr‘How is your health in general?’1 = Male, 2 = Female
2048
Female, 25 to 44